Section 7: Final Meeting
Sam Frederick
Columbia University
4/25/23
Biases and Errors in Research
Biases and Errors in Research
Response Bias: Social Desirability Bias
- Did you vote in the last election?
- Depending on who you’re with, you might be more or less likely to answer this question honestly
Voter Turnout
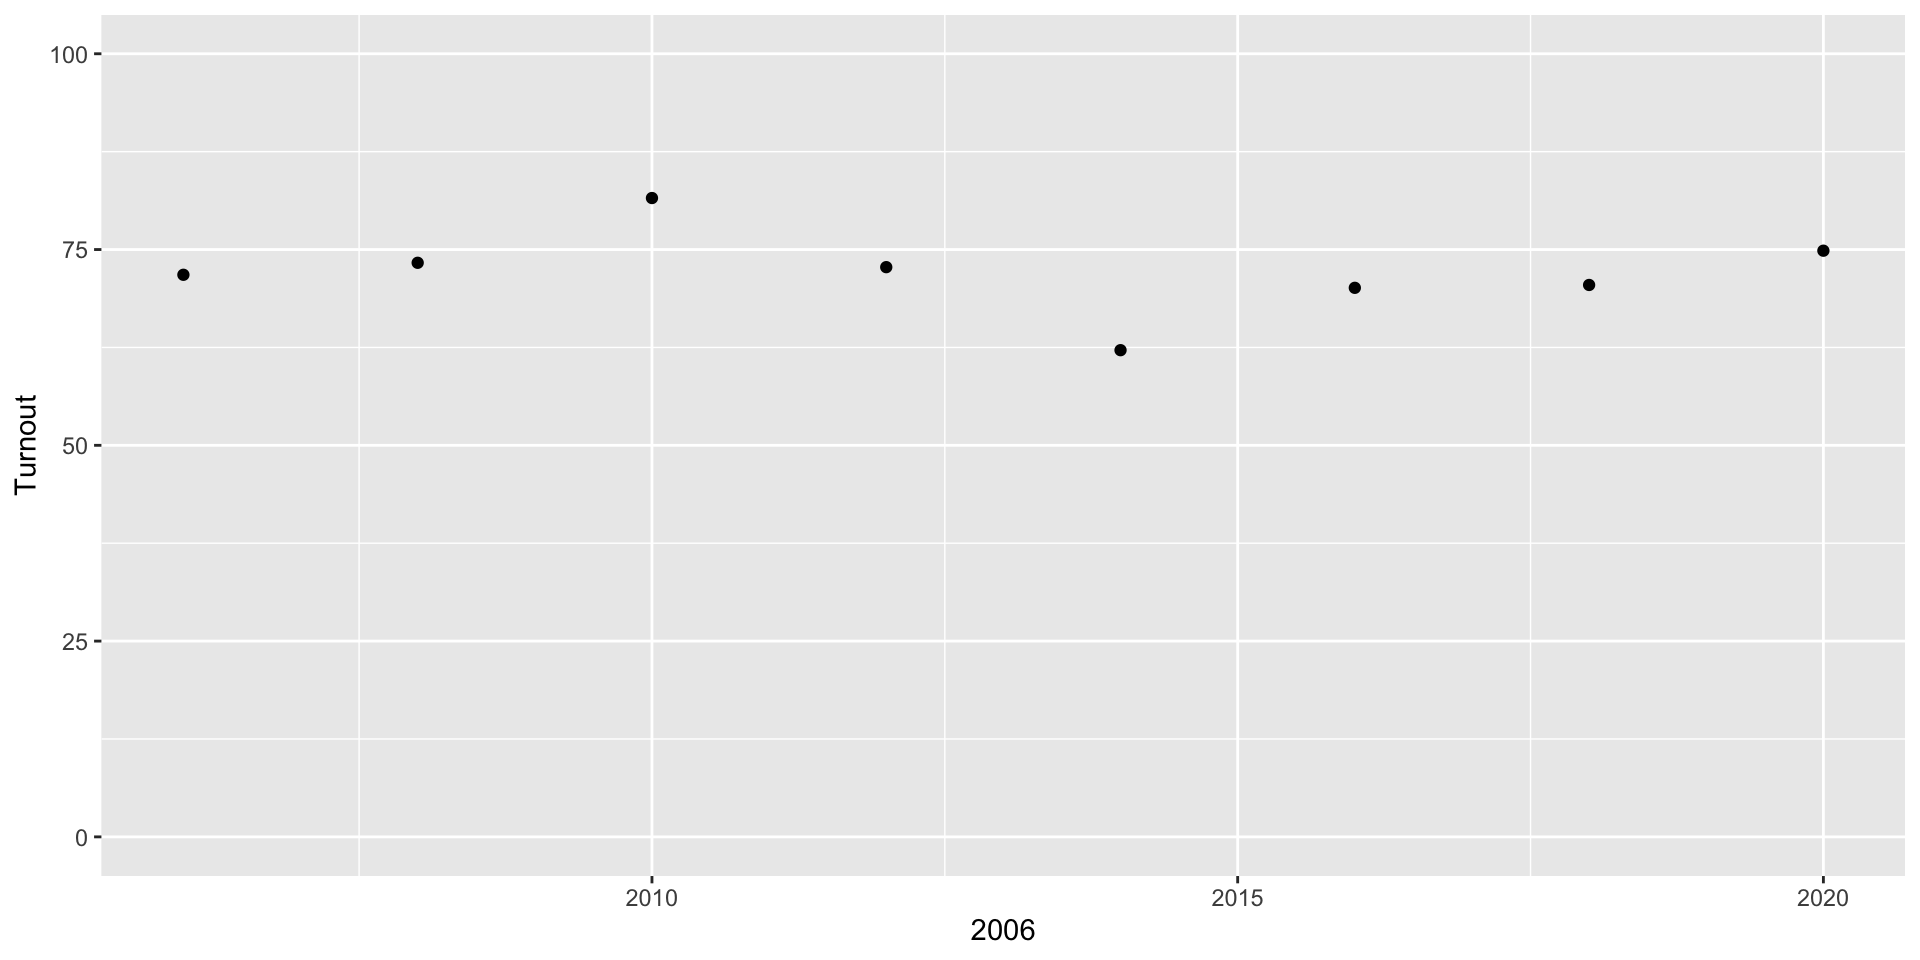
- Let’s look at some survey results:
- What do these results tell us about turnout in elections?
Voter Turnout
- How would we make a scatterplot of turnout from the survey?
Voter Turnout
Voter Turnout
Voter Turnout
Voter Turnout
Voter Turnout
Voter Turnout
Voter Turnout
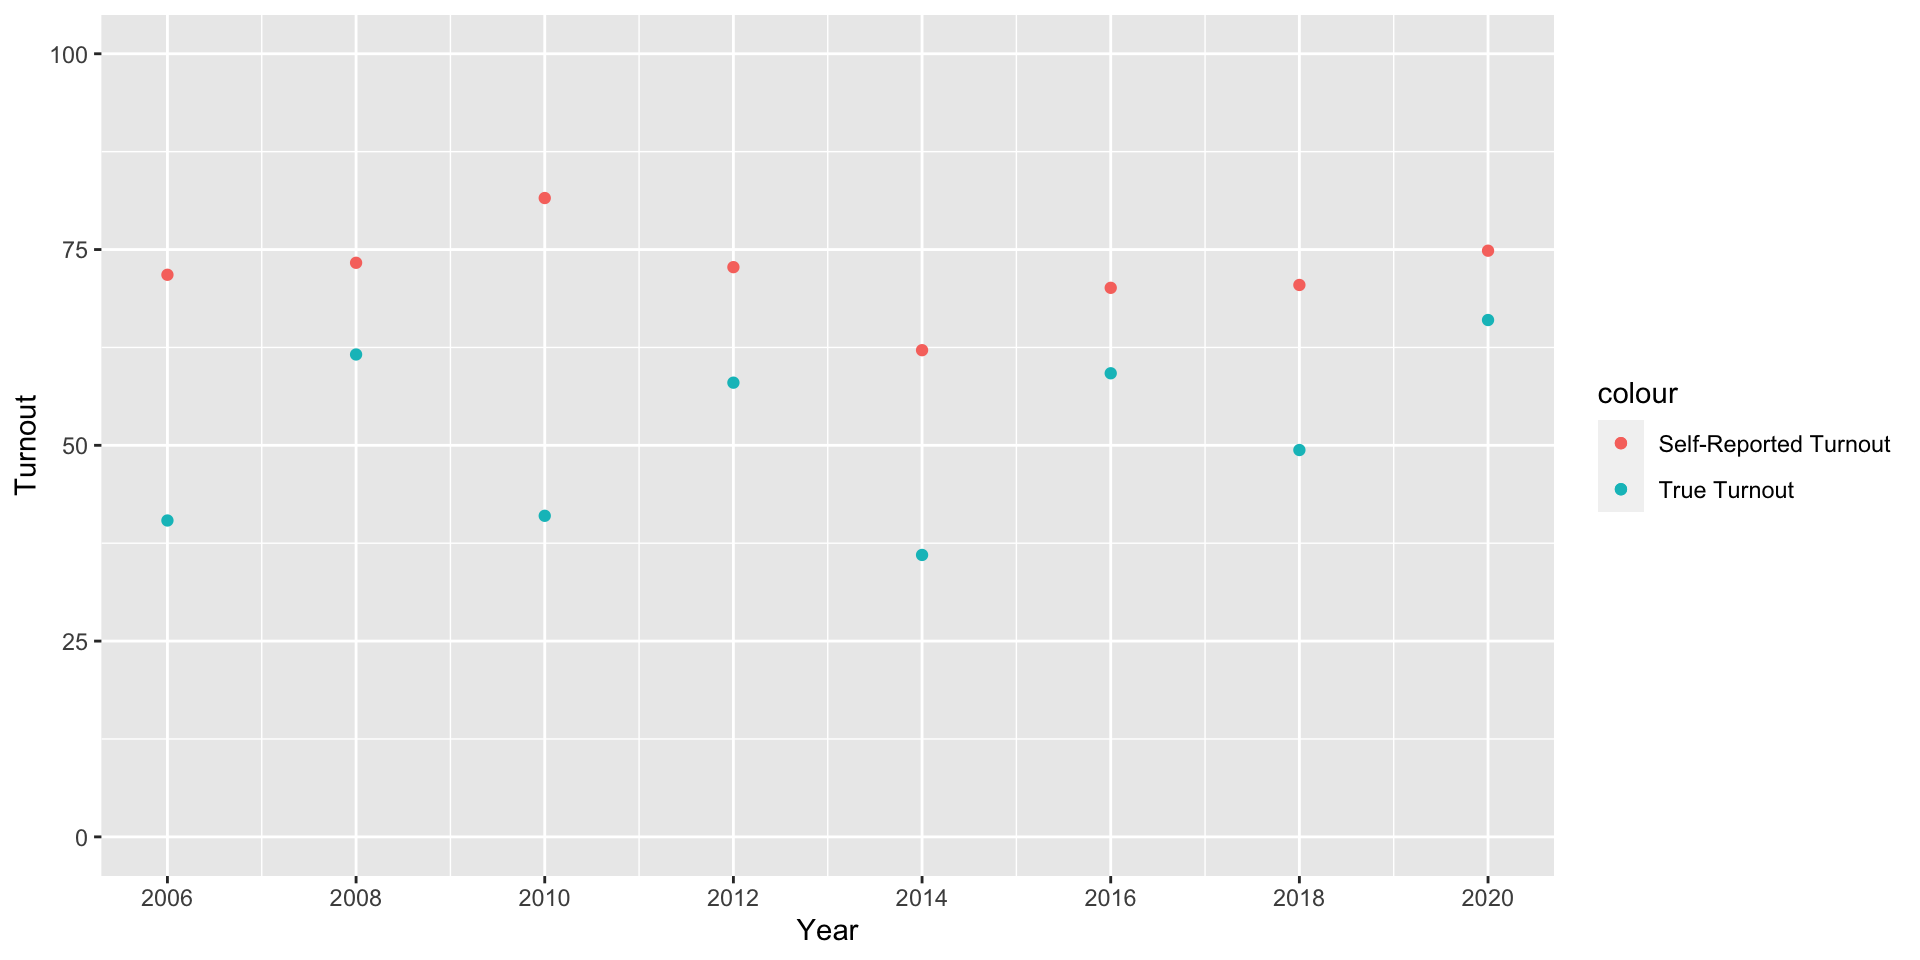
- What about the true turnout?
Voter Turnout
Voter Turnout
Voter Turnout
Voter Turnout

Voter Turnout
- What’s going on here?
- Sampling Error
- Social Desirability Bias
- False/Incorrect Memories
Reducing Social Desirability Bias
- Survey Medium (Face-to-Face, Phone, Online)
- Question Wording
- Anonymized Question Designs
Anonymized/Secret Question Designs
- List Experiments:
- Generate a list of items, including the sensitive item you are really interested in
- Randomly assign participants to “treatment” and “control”
- Treatment receives the sensitive item + other items
- Control receives only other items
- Ask participants how many of the items apply to them
Anonymized/Secret Question Designs
- List Experiments:
- Difference in Means between treatment and control
- Proportion of people to whom the sensitive item applies
- Difference in Means between treatment and control
Anonymized/Secret Question Designs
- Things to look out for with List Experiments
- Ceiling Effects and Floor Effects:
- Control items should be a mix of items that should be expected to both apply and not apply to people
- Violations of this principle removes anonymity
- Ceiling Effects and Floor Effects:
Anonymized/Secret Question Designs
- List Experiments
- Coin flipping, rolling die
- Tell respondents to flip a coin
- If outcome heads, give a certain answer
- If outcome tails, give your true answer
- Know true proportion who flipped heads (0.5), so difference is true proportion on sensitive answer
Qualitative or Case Study Designs
- Choosing Cases:
- Think carefully about which cases will help you best test your theory
- Select across the range of your independent variable(s)
- Be aware of the potential limitations of generalization and specific context of cases
- Consider cases where your theory doesn’t hold
- Does theory need to be refined?
- Do these cases suggest limitations/conditions of theory?
- Think carefully about which cases will help you best test your theory
Qualitative or Case Study Designs
- Combining Qualitative and Quantitative
- Can use mixed methods
- supplement case study with quantitative analysis
- Can use mixed methods
Qualitative or Case Study Designs
- Some Potential Benefits:
- In-Depth knowledge about certain cases
- Better understanding of motivations of political actors
- Better understanding of context
- Can bring area-relevant background knowledge of language, culture, etc.
Qualitative or Case Study Designs
- Some Potential Drawbacks:
- Representativeness/Generalizability
- Causal inference can be challenging
- Need more observations than causes
- Hard to establish counterfactuals
Biases and Errors in Research
Final Section
