Section 5: Sources of Error and Bias in Research
Sam Frederick
Columbia University
3/7/23
Thinking about Bias and Error in Research
Research Process:
Thinking about Bias and Error in Research
Measurement Error:
Measurement Error
Difference between measurements and true underlying concept
Steps to address measurement error:
- think carefully about how we measure the concept of interest
- demonstrate validity of our measures
Thinking about Bias and Error in Research
Sampling Error:
Sampling Error
- Data give unbiased estimates only if they are representative of the population of interest
- Researchers often use convenience samples
- How do we get representative samples?
- Census
- Often infeasible
- Random sampling
- Census
Random Sampling
- Types of random sampling:
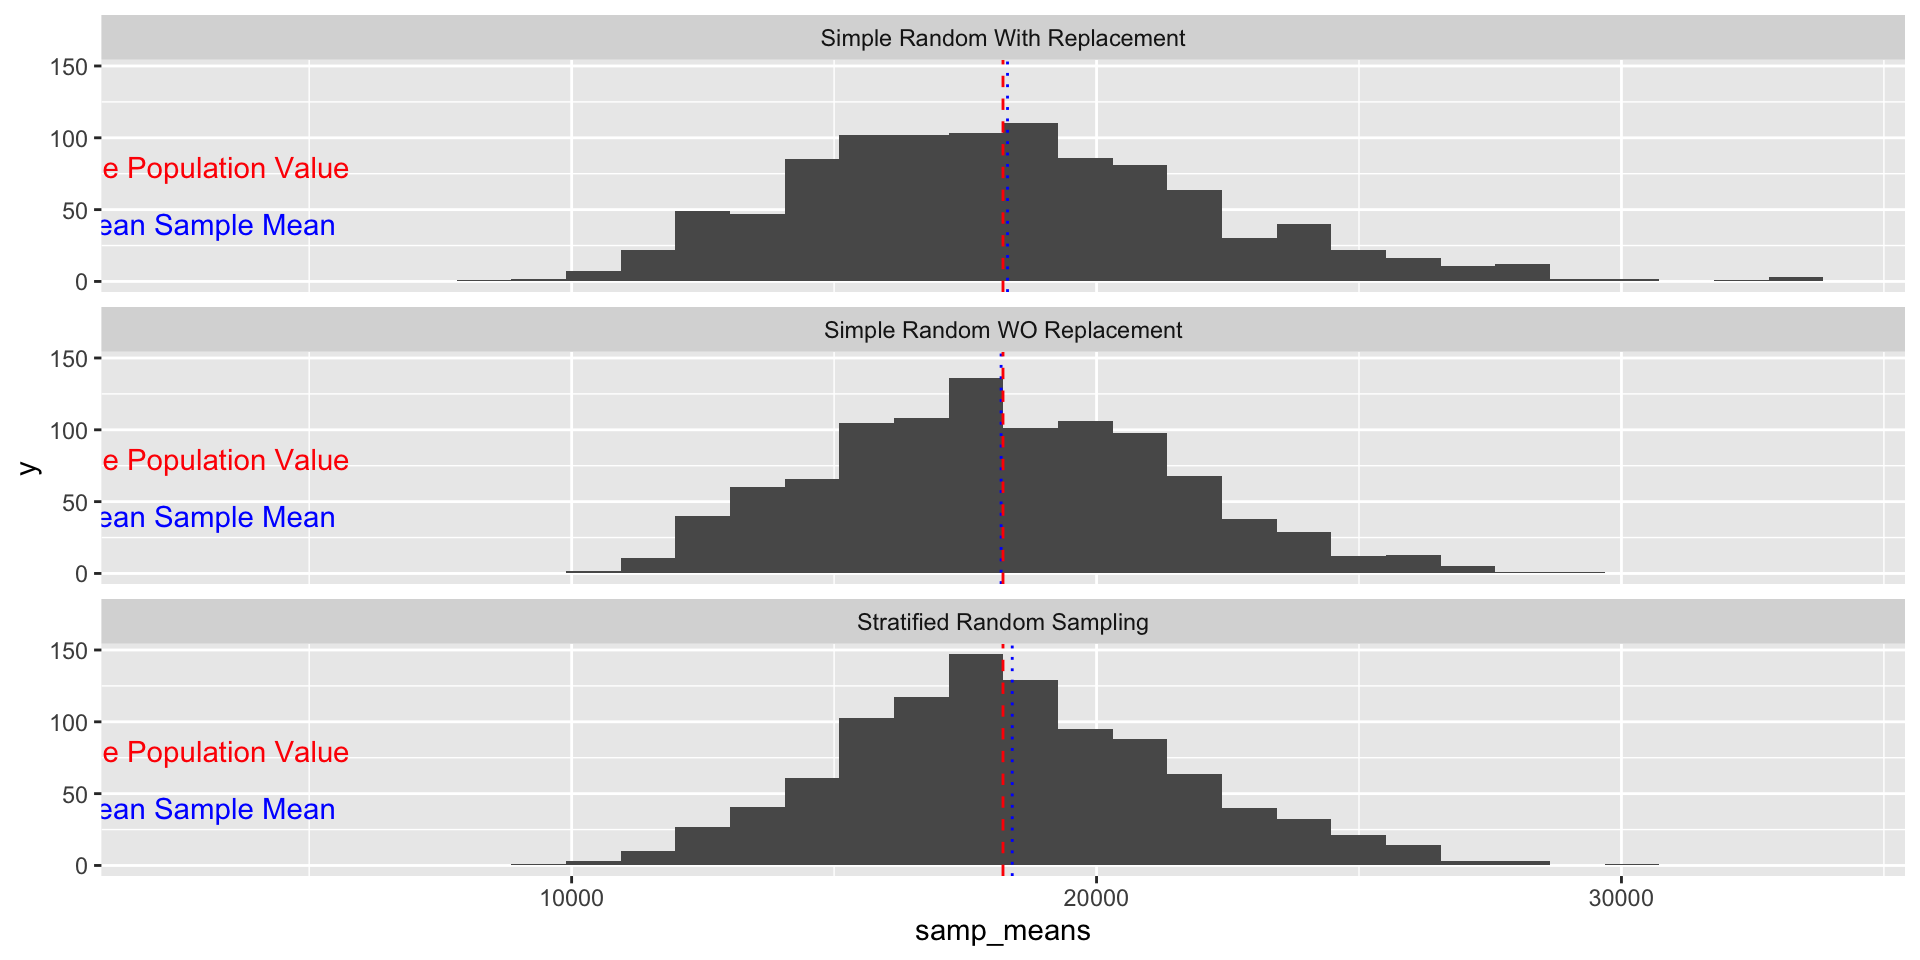
- Simple Random Sampling
- Stratified Random Sampling
- Cluster Random Sampling
Random Sampling
- Simple Random Sampling
- With replacement
- Without replacement
- differences negligible in large populations
- Stratified Random Sampling
- Cluster Random Sampling
Random Sampling
- Simple Random Sampling
- Stratified Random Sampling
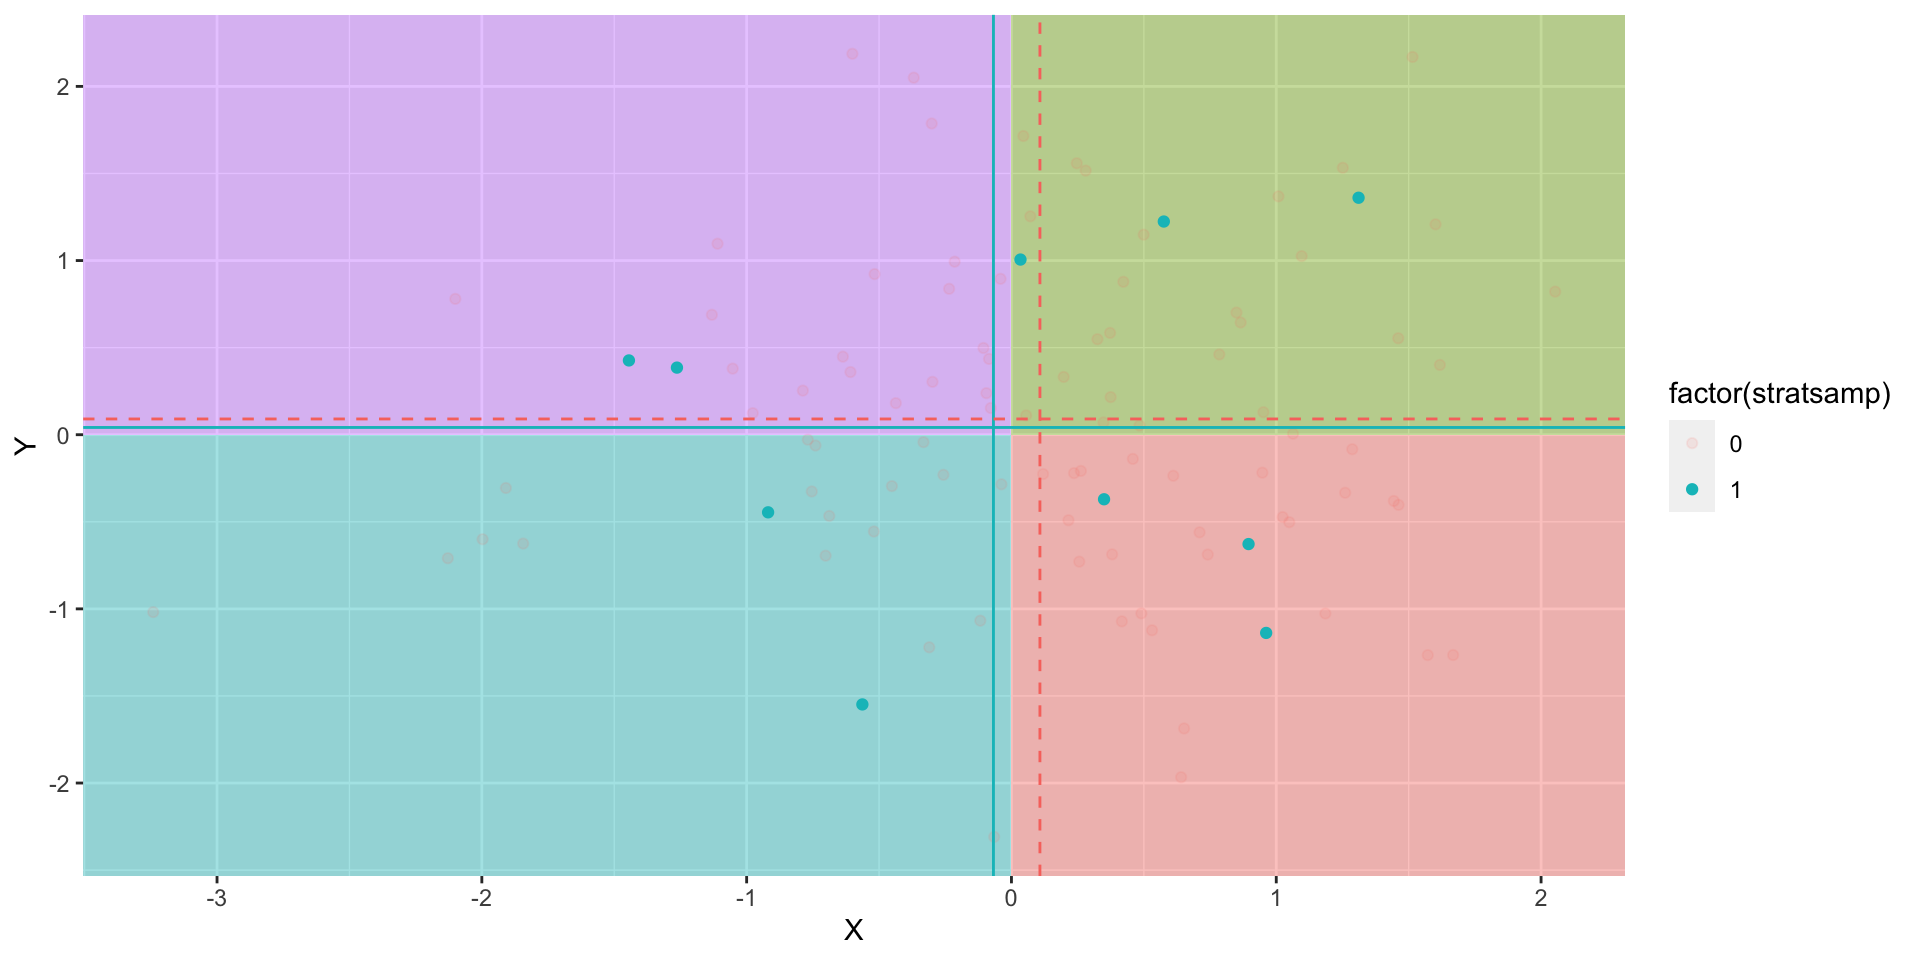
- take all groups in population and pull random samples from the groups
- used to prevent unusual samples
- e.g., a random sample that, by chance, only contains Democrats
- Cluster Random Sampling
Random Sampling
- Simple Random Sampling
- Stratified Random Sampling
- Cluster Random Sampling
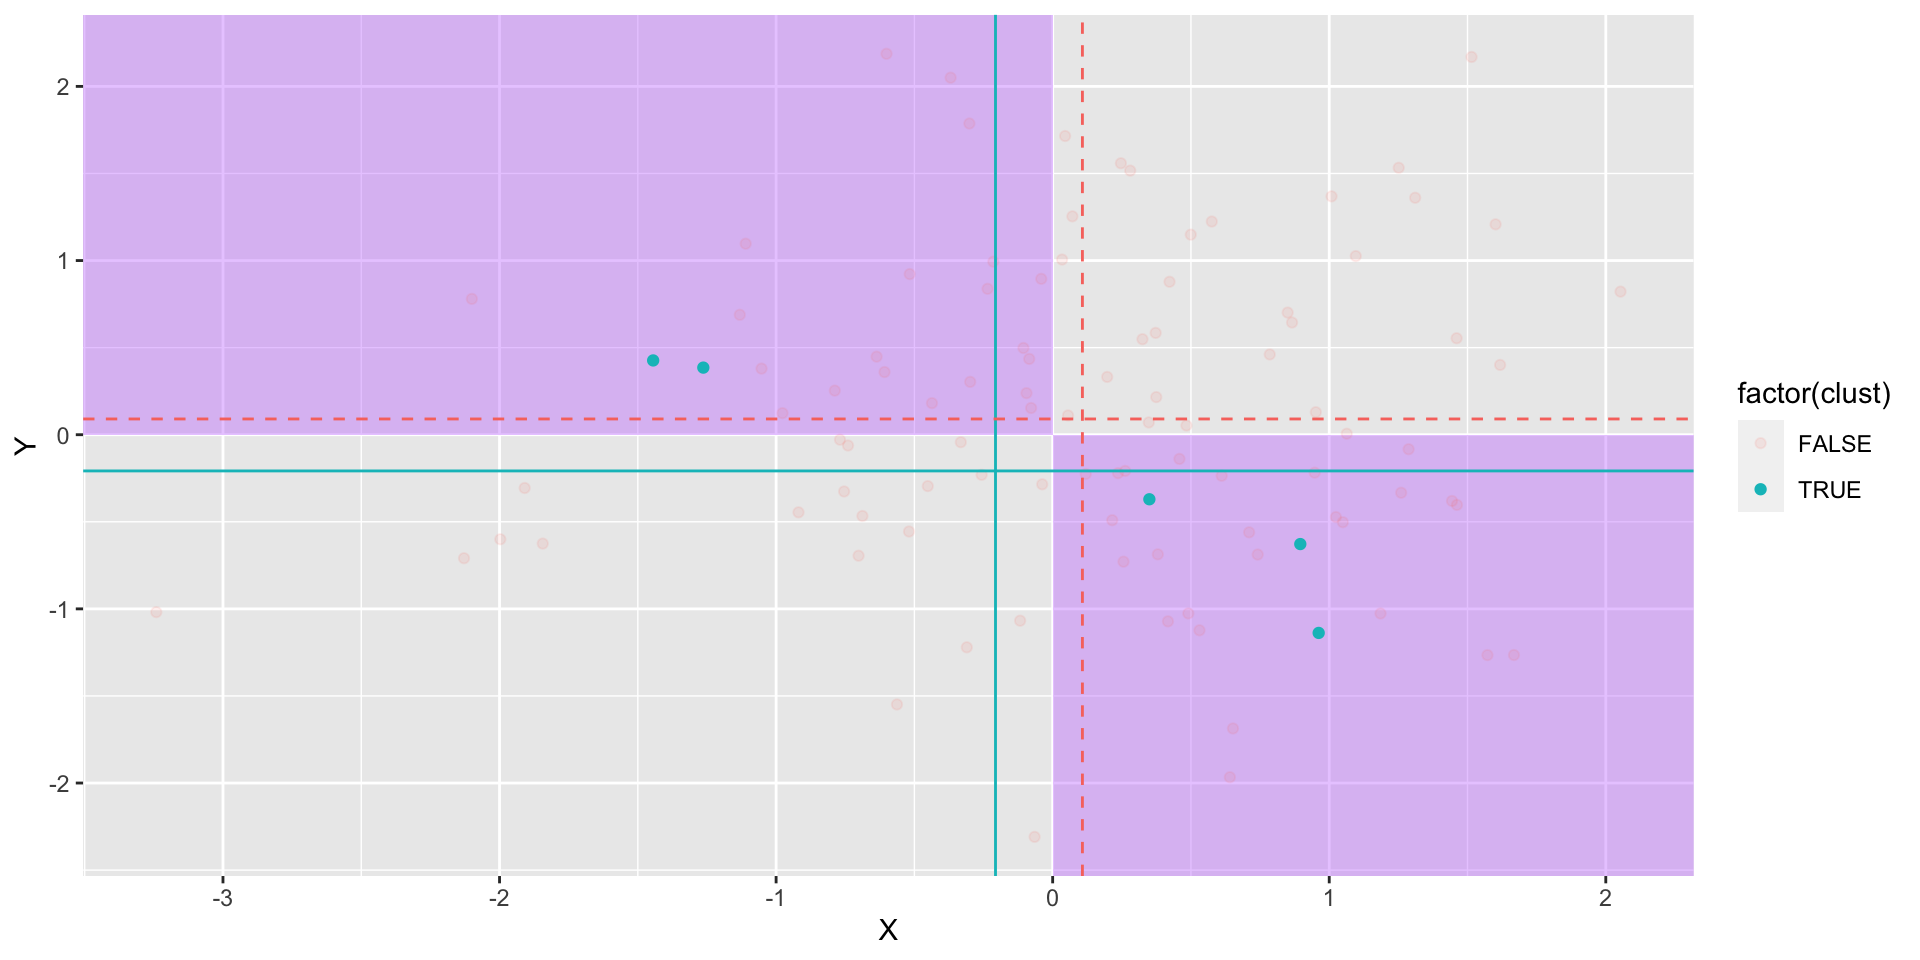
- randomly select groups, like cities, and randomly sample within the groups
Random Sampling
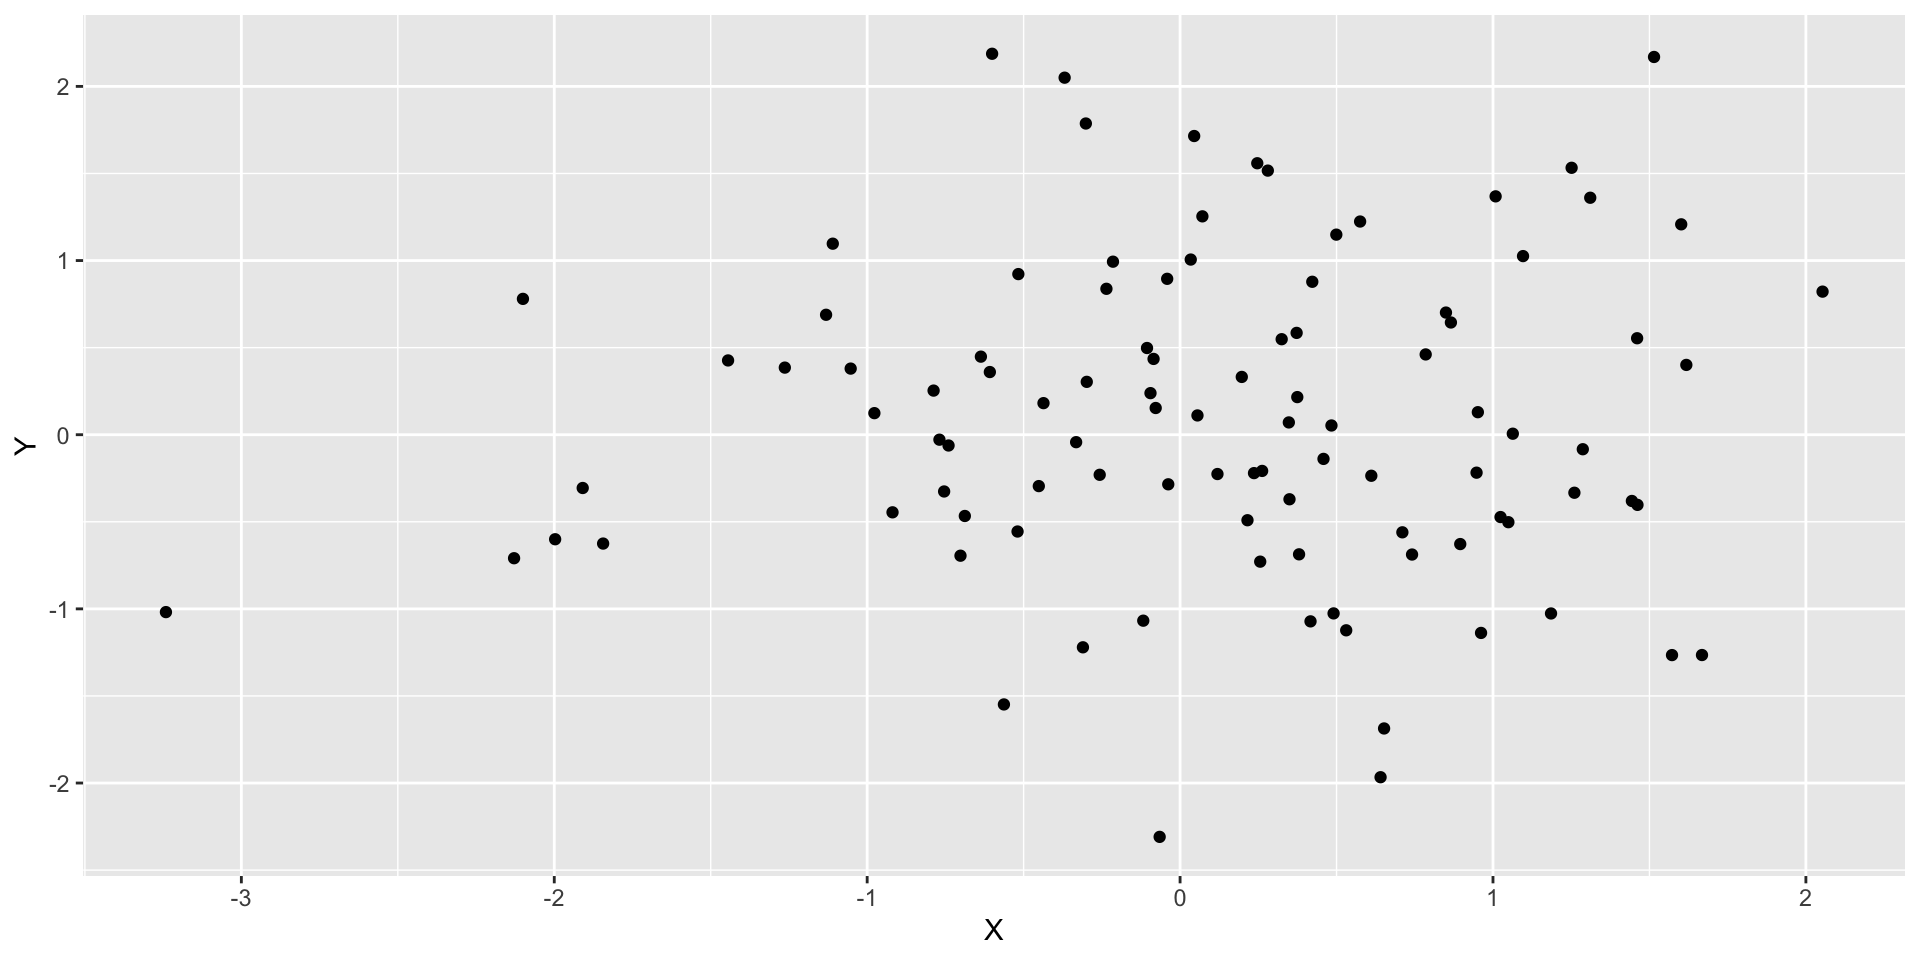
Start with population of size 100
Random Sampling
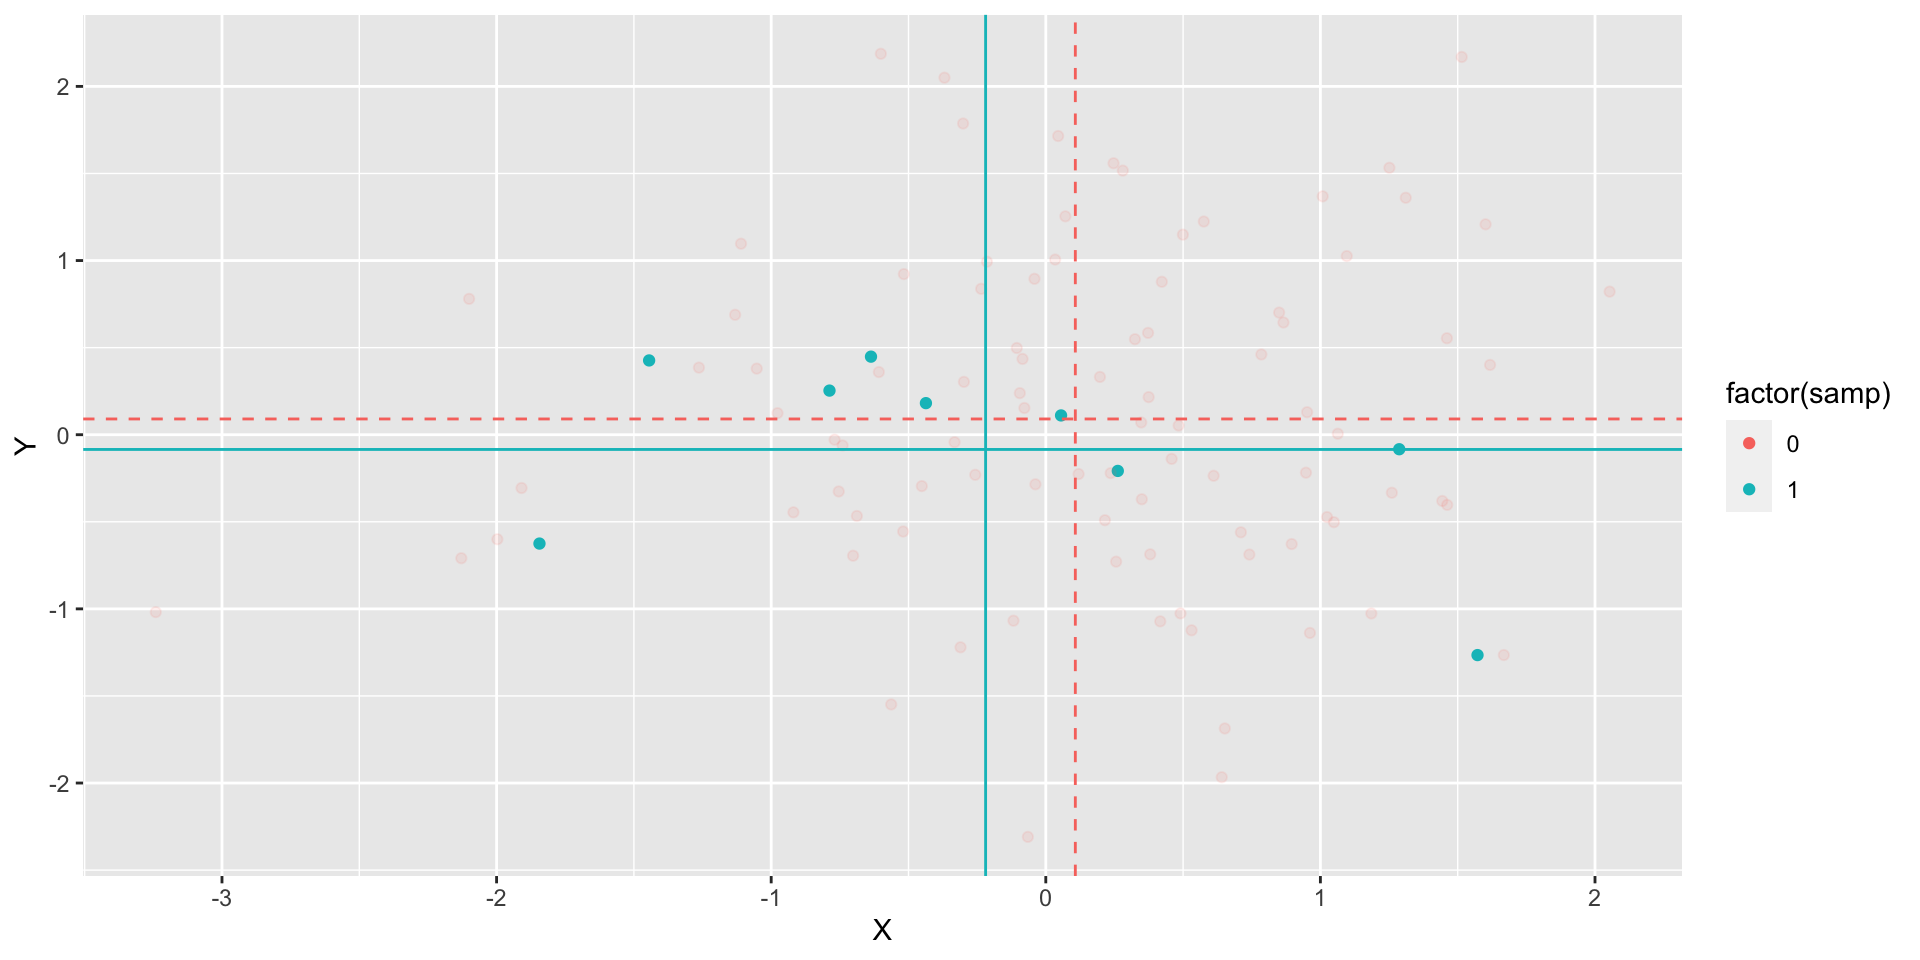
Simple Random Sample Without Replacement

Random Sampling
Simple Random Sampling With Replacement
Random Sampling
Stratified Random Sampling
Random Sampling
Cluster Random Sampling
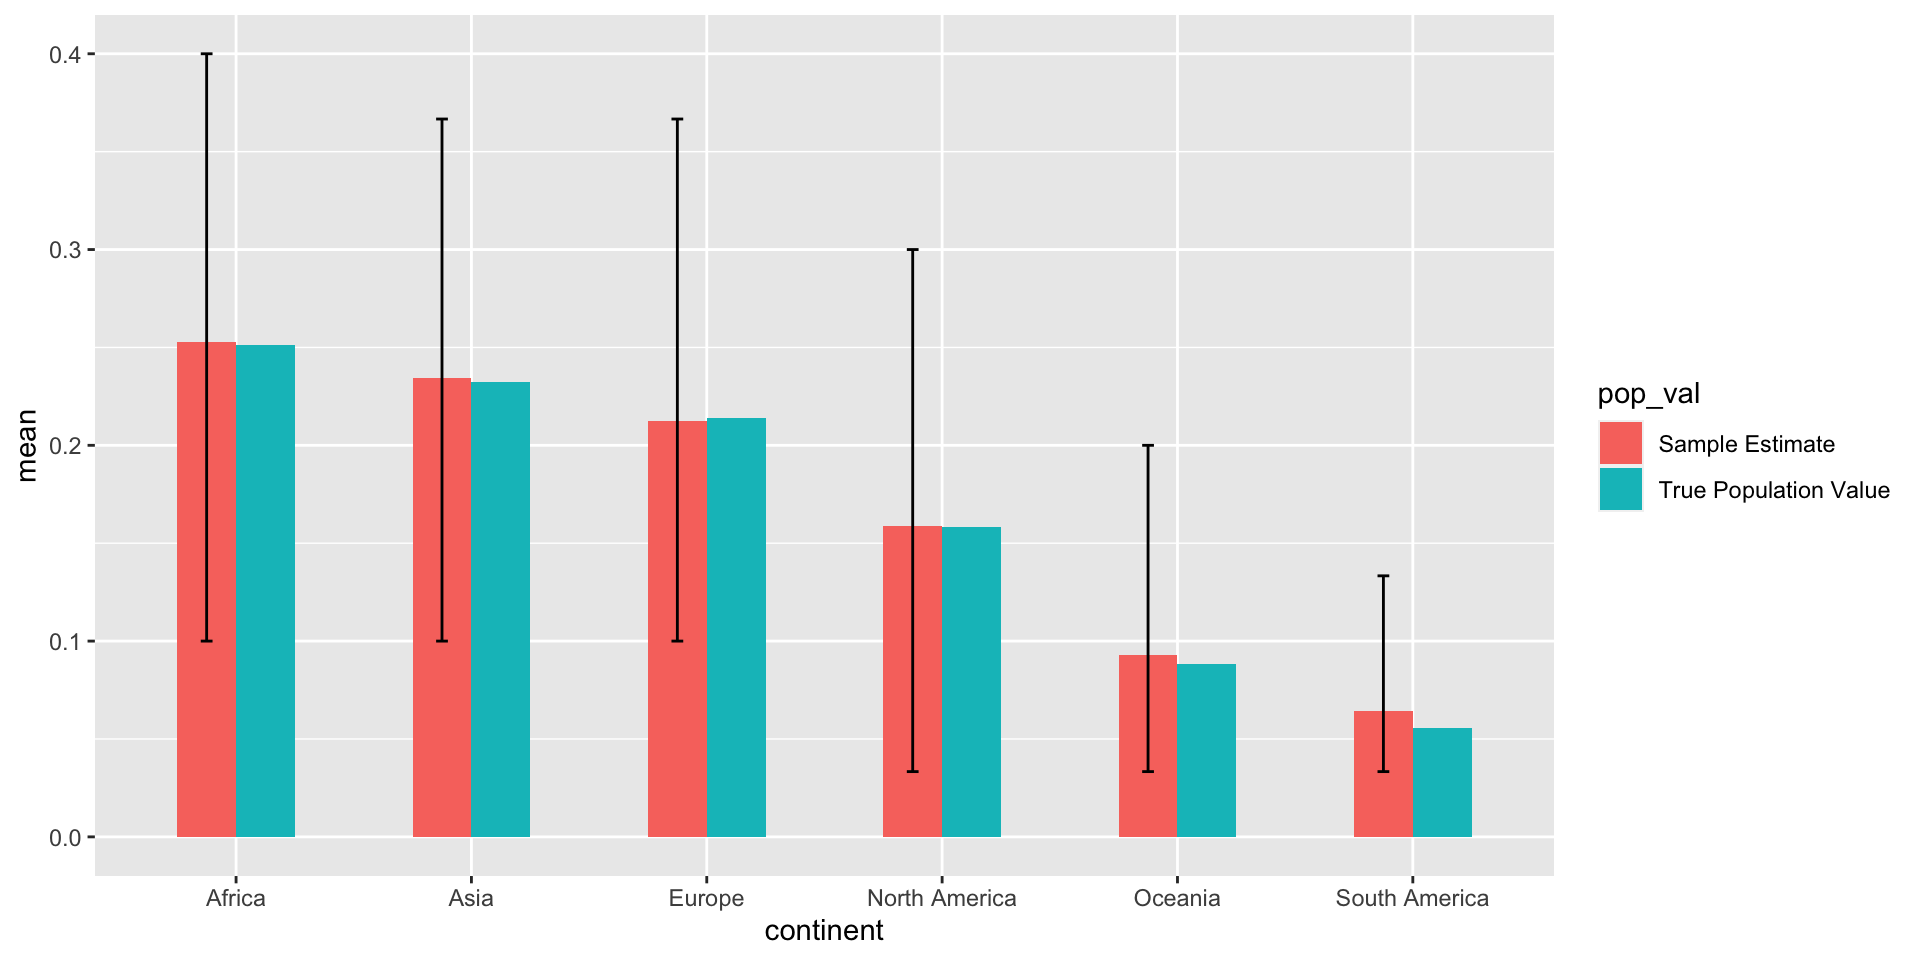
Simple Random Sampling
1000 random samples of size 30 from World Bank data, without replacement
Random Sampling
Thinking About Bias and Error in Research
Nonresponse Bias
Nonresponse Bias
- Different types of people/countries have different probabilities of responding
- Sample essentially non-random even if you have a random sample
- Analyses biased without assumptions
- Usual fix:
- weight data so that responders represent non-responders from their groups
Thinking About Bias and Error in Research
Confounding Variables
Confounding Variables Bias
- Want to make causal claims
- e.g., X causes Y
- GDP per capita causes health outcomes
Confounding Variables
- Observational data usually more like this
- Z is a confounding variable
Confounding Variables
- Confounding variables:
- cause both “treatment” (X) and outcome (Y) of interest
- make it appear that X and Y are related
- one of the reasons correlation \(\neq\) causation
- Example:
- Ice cream consumption and swimming pool use correlated
- Confounding Variables: weather/temperature
Addressing Confounding Variables
- Gold Standard: Randomized Experiments
- Randomization: removes influence of potential confounders
- Experimental Treatment: directly manipulate X variable
Randomized Experiments
Randomized Experiments
Randomized Experiments
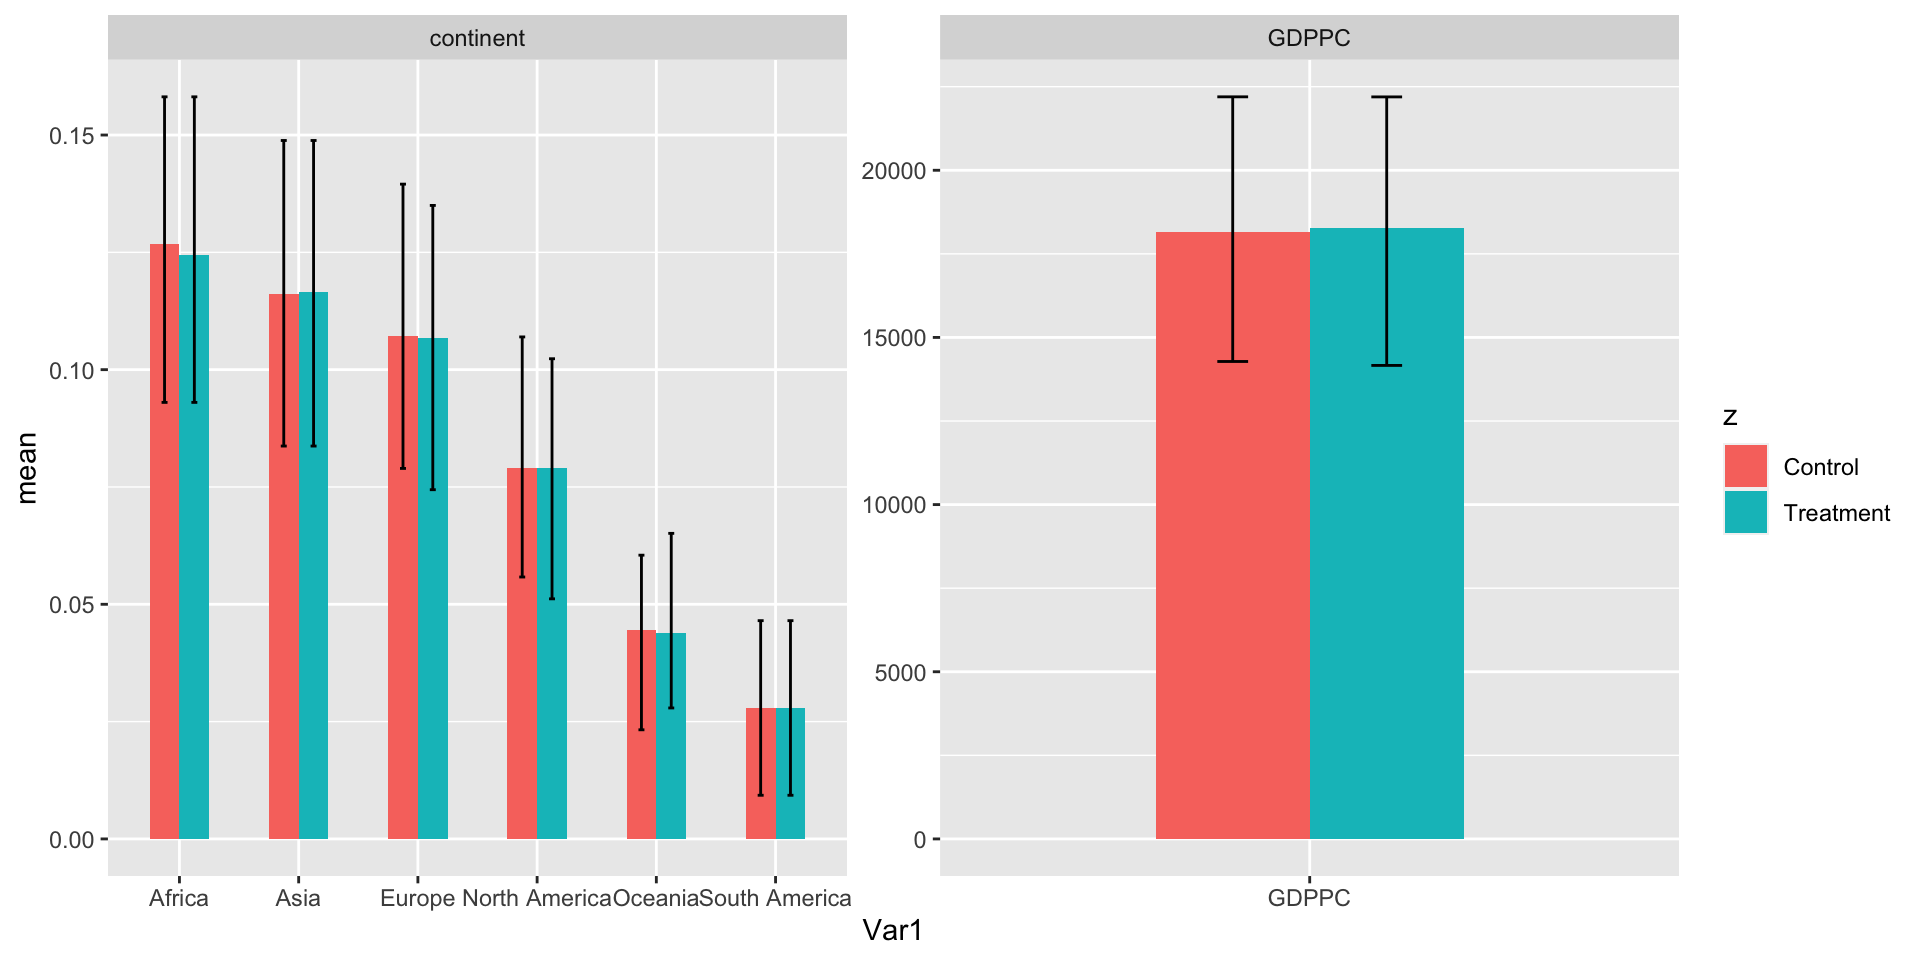
Randomized Experiments
- On average, only difference between treatment and control units is treatment
- To analyze, we just need to compare treated and control units
- The difference is the causal effect of treatment on the outcome
Randomized Experiments
- Average Treatment Effect (ATE):
- Difference in Means between treatment and control
- Is the causal effect statistically significant?
- T-test!
Randomized Experiments
Thinking about Bias and Error in Research
Sources of Error
